The DITA Ventura ranks #435 out of 1253 total In-Ear Headphones for sound quality. See all Headphones rankings for every top pick.
Brand: Dita
Prices on this page were last checked October 16, 2026 at 5:46 PM UTC. Product prices and availability are accurate as of that date/time and are subject to change; the price and availability shown on Amazon at the time of purchase will apply to the purchase of this product.
As an eBay Partner, we may be compensated if you make a purchase.
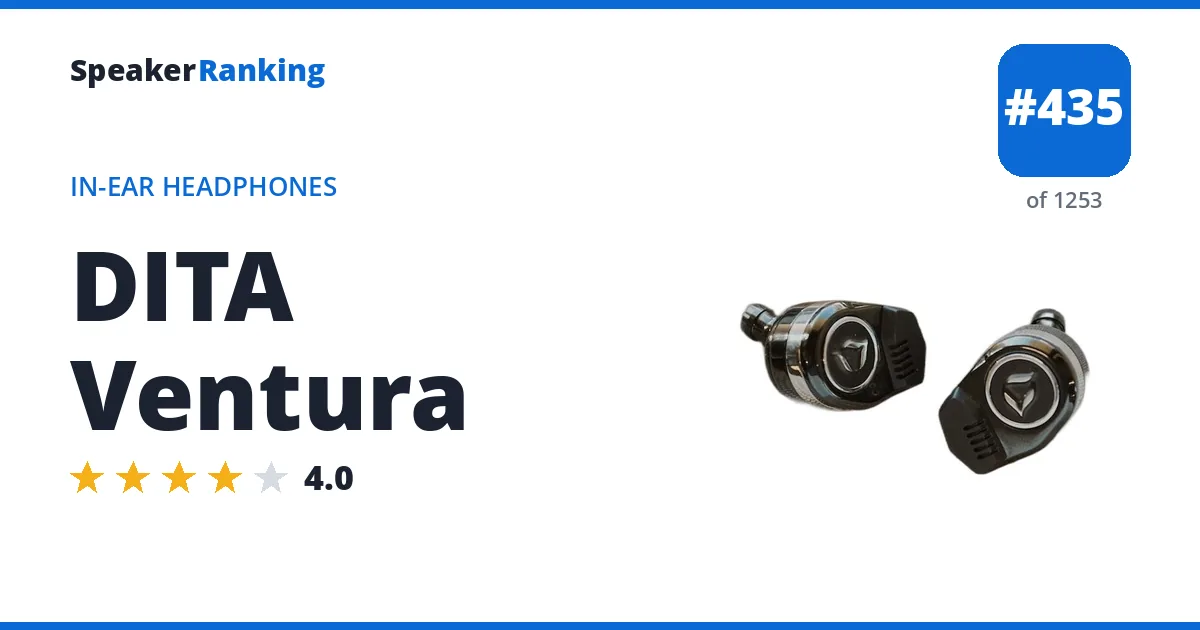
#435 DITA Ventura: $4,799 Bloom Audio $4,799 eBay
Pros: A broadly balanced tuning with a preference score of 74 against the Harman target.
Cons: Treble about 3 dB below target from 3 to 10 kHz, which can sound dull or veiled next to brighter headphones. An uneven response, 1.9 dB standard deviation from target.
Is the DITA Ventura right for you?
Buy it if
- your taste runs warm: it scores 83 for that sound.
- you are sensitive to bright or sharp treble (treble sits 3.2 dB below target).
- you want sub-bass rumble that reaches down to 20 Hz.
- you are happy to use EQ: our preset lifts its Harman match by about 14 points.
Skip it if
- you want the best value: the higher-rated EPZ G10 costs about $4,775 less.
| Back | Closed |
|---|---|
| Connection | Wired |
| Deviation From Target | 1.89 dB standard deviation |
| Driver Type | Dynamic |
| Drivers | 1 x dynamic |
| Form Factor | In-ear |
| Harman Preference Score | 74 (median of 3 squig.link measurements, calibrated to AutoEQ) |
| Sub-bass Extension | Within 6 dB of target down to 20 Hz (-0.2 dB at 30 Hz) |
| Tonal Tilt | -0.52 (negative is warmer, positive brighter) |
EQ Presets
Harman target
Set a preamp of -6.0 dB, then add these filters in any parametric equalizer (Wavelet, Equalizer APO, Peace, or a player with parametric EQ). Calculated by Speaker Ranking from the median of 3 squig.link measurements, in the filter layout AutoEQ uses. Predicted Harman match with this EQ: 88 out of 100, up from 74.
| Filter | Frequency | Gain | Q |
|---|---|---|---|
| Low shelf | 105 Hz | +0.5 dB | 0.70 |
| High shelf | 10,000 Hz | +0.4 dB | 0.70 |
| Peak | 197 Hz | -1.3 dB | 1.35 |
| Peak | 1,543 Hz | -1.6 dB | 2.59 |
| Peak | 3,469 Hz | +6.0 dB | 1.62 |
| Peak | 6,086 Hz | +2.2 dB | 6.00 |
Neutral target
Set a preamp of -6.0 dB, then add these filters in any parametric equalizer (Wavelet, Equalizer APO, Peace, or a player with parametric EQ). Calculated by Speaker Ranking from the median of 3 squig.link measurements, in the filter layout AutoEQ uses. Predicted Neutral match with this EQ: 89 out of 100, up from 39.
| Filter | Frequency | Gain | Q |
|---|---|---|---|
| Low shelf | 105 Hz | -8.1 dB | 0.70 |
| High shelf | 10,000 Hz | +0.4 dB | 0.70 |
| Peak | 186 Hz | -1.2 dB | 1.02 |
| Peak | 1,544 Hz | -1.6 dB | 2.60 |
| Peak | 3,469 Hz | +6.0 dB | 1.62 |
| Peak | 6,086 Hz | +2.2 dB | 6.00 |
Studio flat target
Set a preamp of -6.3 dB, then add these filters in any parametric equalizer (Wavelet, Equalizer APO, Peace, or a player with parametric EQ). Calculated by Speaker Ranking from the median of 3 squig.link measurements, in the filter layout AutoEQ uses. Predicted Studio flat match with this EQ: 86 out of 100, up from 19.
| Filter | Frequency | Gain | Q |
|---|---|---|---|
| Low shelf | 105 Hz | -10.6 dB | 0.70 |
| High shelf | 10,000 Hz | +2.0 dB | 0.70 |
| Peak | 187 Hz | -3.0 dB | 0.82 |
| Peak | 2,954 Hz | +6.0 dB | 1.55 |
| Peak | 3,759 Hz | +2.3 dB | 6.00 |
Warm target
Set a preamp of -4.9 dB, then add these filters in any parametric equalizer (Wavelet, Equalizer APO, Peace, or a player with parametric EQ). Calculated by Speaker Ranking from the median of 3 squig.link measurements, in the filter layout AutoEQ uses. Predicted Warm match with this EQ: 88 out of 100, up from 83.
| Filter | Frequency | Gain | Q |
|---|---|---|---|
| Low shelf | 105 Hz | +0.7 dB | 0.70 |
| High shelf | 10,000 Hz | -3.1 dB | 0.70 |
| Peak | 3,317 Hz | +4.9 dB | 2.51 |
Bass target
Set a preamp of -6.0 dB, then add these filters in any parametric equalizer (Wavelet, Equalizer APO, Peace, or a player with parametric EQ). Calculated by Speaker Ranking from the median of 3 squig.link measurements, in the filter layout AutoEQ uses. Predicted Bass match with this EQ: 90 out of 100, up from 73.
| Filter | Frequency | Gain | Q |
|---|---|---|---|
| Low shelf | 105 Hz | +4.3 dB | 0.70 |
| High shelf | 10,000 Hz | +0.4 dB | 0.70 |
| Peak | 203 Hz | -1.3 dB | 1.51 |
| Peak | 1,542 Hz | -1.6 dB | 2.59 |
| Peak | 3,469 Hz | +6.0 dB | 1.62 |
| Peak | 6,086 Hz | +2.2 dB | 6.00 |
Bright target
Set a preamp of -6.3 dB, then add these filters in any parametric equalizer (Wavelet, Equalizer APO, Peace, or a player with parametric EQ). Calculated by Speaker Ranking from the median of 3 squig.link measurements, in the filter layout AutoEQ uses. Predicted Bright match with this EQ: 84 out of 100, up from 27.
| Filter | Frequency | Gain | Q |
|---|---|---|---|
| Low shelf | 105 Hz | -8.1 dB | 0.70 |
| High shelf | 10,000 Hz | +2.0 dB | 0.70 |
| Peak | 23 Hz | -1.0 dB | 1.88 |
| Peak | 186 Hz | -1.2 dB | 0.93 |
| Peak | 1,613 Hz | -2.3 dB | 2.04 |
| Peak | 3,354 Hz | +6.0 dB | 1.14 |
| Peak | 4,308 Hz | +1.5 dB | 5.83 |
| Peak | 5,777 Hz | +4.2 dB | 6.00 |
V-shaped target
Set a preamp of -6.2 dB, then add these filters in any parametric equalizer (Wavelet, Equalizer APO, Peace, or a player with parametric EQ). Calculated by Speaker Ranking from the median of 3 squig.link measurements, in the filter layout AutoEQ uses. Predicted V-shaped match with this EQ: 80 out of 100, up from 65.
| Filter | Frequency | Gain | Q |
|---|---|---|---|
| Low shelf | 105 Hz | +4.9 dB | 0.70 |
| High shelf | 10,000 Hz | +2.0 dB | 0.70 |
| Peak | 51 Hz | +0.7 dB | 1.29 |
| Peak | 444 Hz | +0.8 dB | 1.23 |
| Peak | 1,564 Hz | -2.6 dB | 1.81 |
| Peak | 3,148 Hz | +6.0 dB | 1.07 |
| Peak | 4,243 Hz | +1.4 dB | 6.00 |
| Peak | 5,545 Hz | +3.8 dB | 3.44 |
- Reviews, Comparisons and Sound Samples
Frequency Response
How the DITA Ventura measures across the audible range, against the Harman in-ear target that most listeners prefer in blind tests. Where the line sits above the target that range sounds louder (more bass, brighter treble), below it quieter. The curve is the median of 3 independent measurements, so one odd sample or rig cannot skew it, and both lines are shifted so their 500 Hz to 2 kHz average sits at 0 dB.
Measurement data: median of 3 measurements from the squig.link databases of aden, dchpgall and eliseaudio. Thanks to each of them for publishing their work.